ANZ TMT Research Reports
Browse our full catalogue of market research, forecasts, and industry analysis covering Telco, Media, Enterprise ICT, Digital Infrastructure and Platforms.
11 June 2026 · DIGITAL INFRASTRUCTURE · BRIEF

Australia's AI Bargain: Capital Without Control
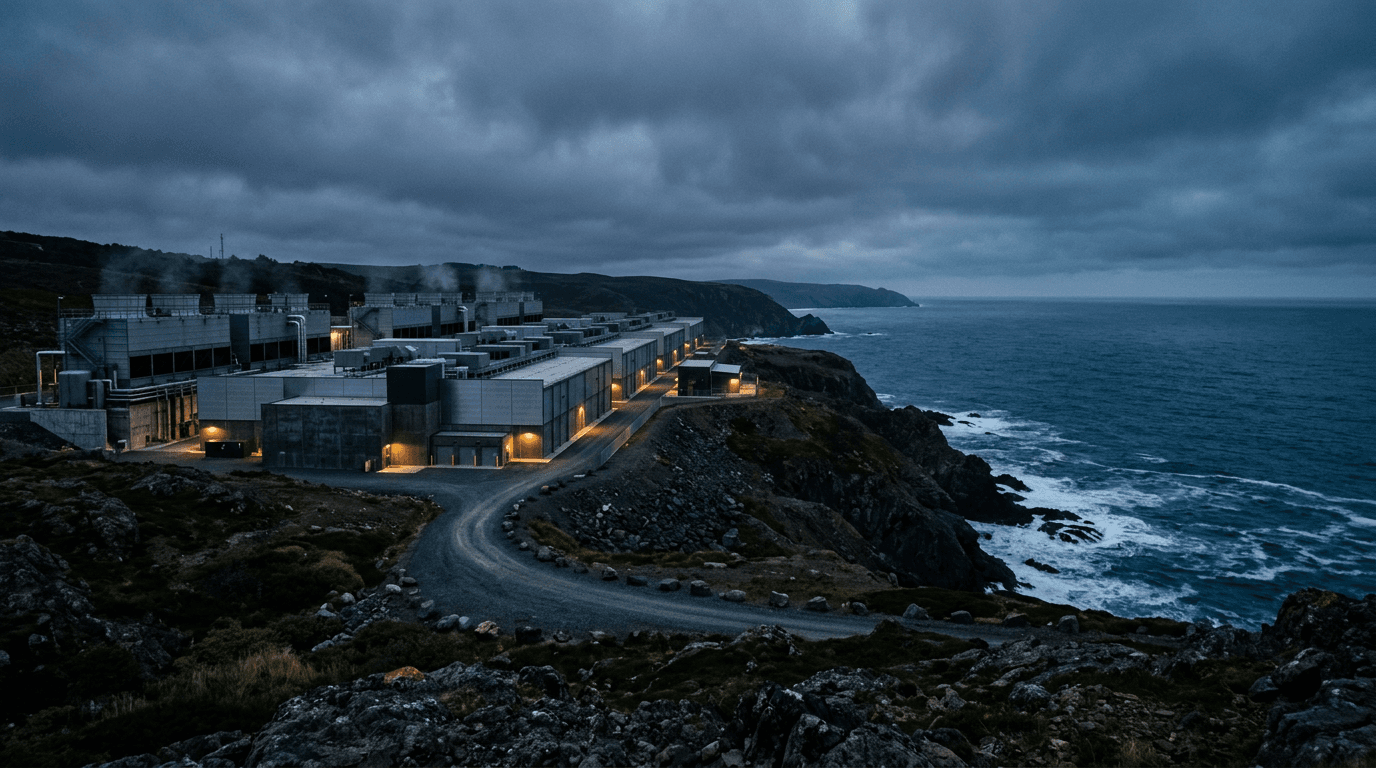
Australia is absorbing large-scale AI infrastructure investment — led by Anthropic and Microsoft — under a policy framework that is deliberately non-binding. The National AI Plan (2026) positions Australia as a destination for foreign AI capital but imposes no mandatory guardrails on frontier AI de…3 June 2026 · DIGITAL INFRASTRUCTURE · MONTHLY COMMENTARY

21.6% Decline for Cogent Leads Mixed Digital Infrastructure Performance in May 2026
The digital infrastructure sector saw divergent performance in May 2026, characterized by aggressive capital raising and strategic divestments. Cogent Communications led the downside with a 21.6% decline following a major asset sale, while Nextdc rose 7.0% on the back of a significant $1.8 billion…1 May 2026 · DIGITAL INFRASTRUCTURE · MONTHLY COMMENTARY· Free

Digital Infrastructure Surges in April 2026 on Record Data Center Utilization and Graphene Breakthroughs
12 June 2026 · Enterprise ICT · Report· NEW
Geopolitical Tech Protectionism and Sovereign Imperatives: Strategic Implications of the Claude Fable Recall for Australia and New Zealand
The abrupt global suspension of Anthropic’s Claude Fable 5 and Mythos 5 artificial intelligence models on June 12, 2026, represents a critical shift in the geopolitics of advanced technology. By using export control authorities to restrict access to software models, the United States government has…Geopolitical Tech Protectionism and Sovereign Imperatives: Strategic Implications of the Claude Fable Recall for Australia and New Zealand
The abrupt global suspension of Anthropic’s Claude Fable 5 and Mythos 5 artificial intelligence models on June 12, 2026, represents a critical shift in the geopolitics of advanced technology. By using export control authorities to restrict access to software models, the United States government has…
11 June 2026 · Digital Infrastructure · Brief
Australia's AI Bargain: Capital Without Control
Australia is absorbing large-scale AI infrastructure investment — led by Anthropic and Microsoft — under a policy framework that is deliberately non-binding. The National AI Plan (2026) positions Australia as a destination for foreign AI capital but imposes no mandatory guardrails on frontier AI de…Australia's AI Bargain: Capital Without Control
Australia is absorbing large-scale AI infrastructure investment — led by Anthropic and Microsoft — under a policy framework that is deliberately non-binding. The National AI Plan (2026) positions Australia as a destination for foreign AI capital but imposes no mandatory guardrails on frontier AI de…
11 June 2026 · Telecom· Free

Starlink IPO: What It Means for Australian Investors and the ANZ Connectivity Market
The SpaceX IPO is not just another tech listing — it is the largest in financial history. SpaceX is targeting a 12 June 2026 Nasdaq listing under the ticker SPCX, with share pricing confirmed after market close on 11 June at US$135 per share, targeting a valuation of US$1.75 trillion. This eclipses…Starlink IPO: What It Means for Australian Investors and the ANZ Connectivity Market
The SpaceX IPO is not just another tech listing — it is the largest in financial history. SpaceX is targeting a 12 June 2026 Nasdaq listing under the ticker SPCX, with share pricing confirmed after market close on 11 June at US$135 per share, targeting a valuation of US$1.75 trillion. This eclipses…
5 June 2026 · Telecom · Report

SpaceX’s Starlink Ambition: How LEOSat Threatens Telcos’ Grip on the ANZ Connectivity Market
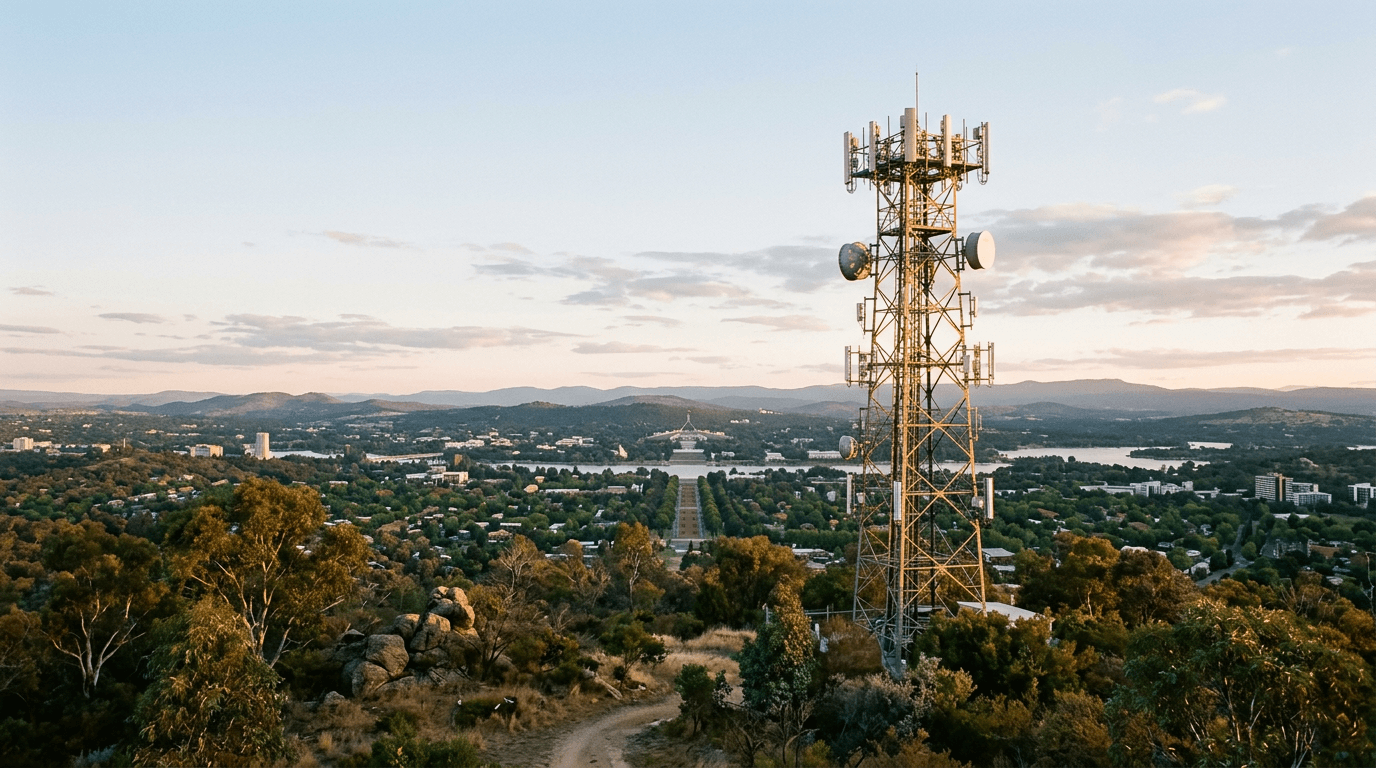
This report explores the impact of expanding Starlink LEOSat capacity in the ANZ market, and how domestic telecommunications operators in these markets will be affected by growing competition from Starlink broadband and mobile services.SpaceX’s Starlink Ambition: How LEOSat Threatens Telcos’ Grip on the ANZ Connectivity Market
This report explores the impact of expanding Starlink LEOSat capacity in the ANZ market, and how domestic telecommunications operators in these markets will be affected by growing competition from Starlink broadband and mobile services.
5 June 2026 · Telecom · Explainer

Explainer: Starlink LEOSat technology evolution
This explainer analyses the rapid technological iteration of SpaceX’s Starlink satellite constellation, tracing its evolution from the 20 Gbps V1 baseline to the upcoming 1 Tbps V3 satellites. It explores how these advancements shift Starlink from a niche rural provider to a direct competitor for t…Explainer: Starlink LEOSat technology evolution
This explainer analyses the rapid technological iteration of SpaceX’s Starlink satellite constellation, tracing its evolution from the 20 Gbps V1 baseline to the upcoming 1 Tbps V3 satellites. It explores how these advancements shift Starlink from a niche rural provider to a direct competitor for t…
4 June 2026 · Media · Forecast

Australia Advertising Expenditure Forecast 2026
We forecast the total advertising market to grow at a 3.6% CAGR over the next five years, stabilised after a period of pandemic and post-pandemic disruption. Overall, the momentum of digital will be blunted by technological disruption. The beneficiaries are the ‘traditional’ media who will improve…Australia Advertising Expenditure Forecast 2026
We forecast the total advertising market to grow at a 3.6% CAGR over the next five years, stabilised after a period of pandemic and post-pandemic disruption. Overall, the momentum of digital will be blunted by technological disruption. The beneficiaries are the ‘traditional’ media who will improve…
3 June 2026 · Digital Infrastructure · Monthly Commentary
21.6% Decline for Cogent Leads Mixed Digital Infrastructure Performance in May 2026
The digital infrastructure sector saw divergent performance in May 2026, characterized by aggressive capital raising and strategic divestments. Cogent Communications led the downside with a 21.6% decline following a major asset sale, while Nextdc rose 7.0% on the back of a significant $1.8 billion…21.6% Decline for Cogent Leads Mixed Digital Infrastructure Performance in May 2026
The digital infrastructure sector saw divergent performance in May 2026, characterized by aggressive capital raising and strategic divestments. Cogent Communications led the downside with a 21.6% decline following a major asset sale, while Nextdc rose 7.0% on the back of a significant $1.8 billion…
3 June 2026 · Telecom · Monthly Commentary
Megaport Surges 69% as AI Infrastructure Demand Offsets Tuas Acquisition Collapse
The Telco sector in May 2026 was defined by extreme volatility driven by AI infrastructure pivots and failed M&A activity. Megaport emerged as the top performer with a 69.4% surge following major contract wins, while Tuas saw its market value collapse by 65.0% after the termination of its M1 Limite…Megaport Surges 69% as AI Infrastructure Demand Offsets Tuas Acquisition Collapse
The Telco sector in May 2026 was defined by extreme volatility driven by AI infrastructure pivots and failed M&A activity. Megaport emerged as the top performer with a 69.4% surge following major contract wins, while Tuas saw its market value collapse by 65.0% after the termination of its M1 Limite…
1 June 2026 · Media

15.4% Surge in oOh Media Leads Sector as M&A Activity Offsets Governance Turmoil
The media sector experienced significant divergence in May 2026, characterised by aggressive M&A activity and governance setbacks. oOh Media emerged as the top performer with a 15.4% increase following a bidding war, while ARN Media fell 10.7% amid a shareholder revolt and substantial revenue losse…15.4% Surge in oOh Media Leads Sector as M&A Activity Offsets Governance Turmoil
The media sector experienced significant divergence in May 2026, characterised by aggressive M&A activity and governance setbacks. oOh Media emerged as the top performer with a 15.4% increase following a bidding war, while ARN Media fell 10.7% amid a shareholder revolt and substantial revenue losse…
22 May 2026 · Telecom · Report

New Spectrum Taxes: Why “Business As Usual” is a Perilous Assumption
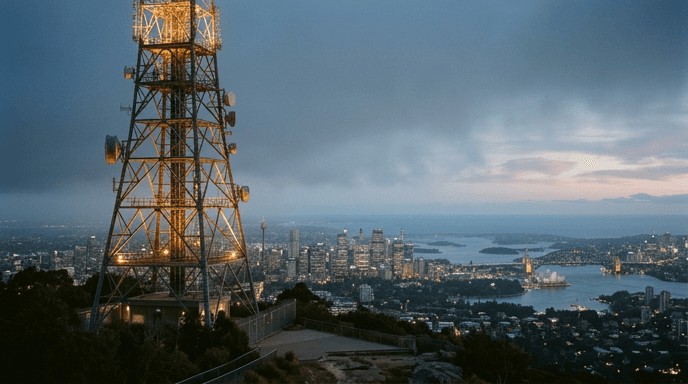
The Australian Communications and Media Authority (ACMA) has finalised a $7.32 billion spectrum license renewal fee, a decision that has met with significant industry resistance. This report analyzes the disconnect between regulatory pricing models and the emerging reality of the digital economy, w…New Spectrum Taxes: Why “Business As Usual” is a Perilous Assumption
The Australian Communications and Media Authority (ACMA) has finalised a $7.32 billion spectrum license renewal fee, a decision that has met with significant industry resistance. This report analyzes the disconnect between regulatory pricing models and the emerging reality of the digital economy, w…
15 May 2026 · Media · Report
FTA TV Recovery Requires Ad Agency Re-set: Moving from Clicks to Value
This report analyses the Australian free-to-air (FTA) television landscape, focusing on the shift from traditional broadcast to Broadcaster Video on Demand (BVOD). It explores the correlation between GDP growth and advertising expenditure, the impact of media agency incentive structures on TV's mar…FTA TV Recovery Requires Ad Agency Re-set: Moving from Clicks to Value
This report analyses the Australian free-to-air (FTA) television landscape, focusing on the shift from traditional broadcast to Broadcaster Video on Demand (BVOD). It explores the correlation between GDP growth and advertising expenditure, the impact of media agency incentive structures on TV's mar…
1 May 2026 · Digital Infrastructure · Monthly Commentary· Free
Digital Infrastructure Surges in April 2026 on Record Data Center Utilization and Graphene Breakthroughs
Digital Infrastructure Surges in April 2026 on Record Data Center Utilization and Graphene Breakthroughs
Need Custom Research?
Our team of analysts can deliver tailored market intelligence reports specific to your business needs.
Request Custom Report